
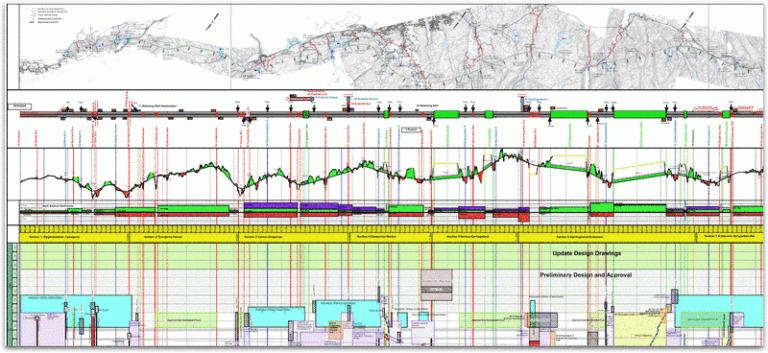
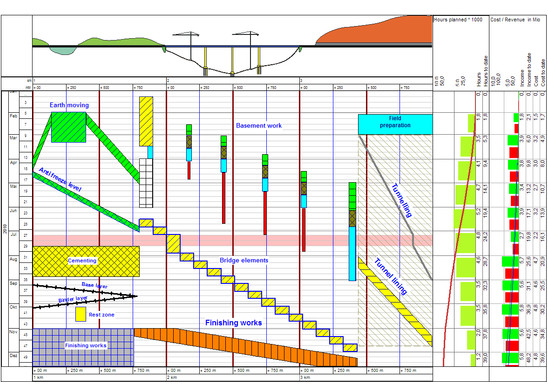
TILOS, Time-Location Diagrams, Time-Chainage Diagrams, or Time-Scale Diagrams are used to add the location dimension to a standard Gantt view. This makes it possible to visualise where and when the work will take place.
This type of planning tool is most often used for so-called “linear” projects, meaning projects that start in one place and end in another location. Thus, we logically find its application in project types such as road, railway and even tunnel and bridge construction.
More generally, it is possible to adapt this tool to any type of project, since this view is especially practical when space is an important factor such as in interface management and access to planning or when different batches are needed to complete work in one location before moving to the next, thus enabling the work to be highlighted in sequence. The use of time-location diagrams allows the planner to develop and explicitly convey the sequences needed for carrying out the work and enables resource optimisation while preventing the risks arising from work that takes place at the same time as other work.
High-powered graphics means it can be used for any type of project, whether the work is in the research, implementation, or operational phase.
The graphics library used to display Time-Location Diagrams enables you to see a clear visualisation ordered by activity type via the use of shapes and colours. As well as enabling you to see where and when actions must be carried out, it is also possible to add a lot of information in order to create a powerful communication tool, for example by inserting a lengthwise profile, a map, a diagram of land displacement, different schematics and environmental or works areas, as well as a bar chart of the resources, equipment and costs, etc.
Of course, the more information there is, the more the display is loaded down, so we will need to filter and/or set the level of detail we want to display.


